The Ultimate Beginner's Guide to Google Analytics [2024]
This is a comprehensive guide to Google Analytics which will help you create better reports, get more user data, identify your best performing channels and much more.
Updated December 11, 2023.
![The Ultimate Beginner's Guide to Google Analytics [{year}] main image](jpg/631ee15f68f33521ce232688_googleanalyticsbeginnersguide_c9306a507f58bf4369b914de1bd4d429_2000-1699775565283.jpg)
For any website large or small, online store, or service business one tool that you should absolutely be using is Google Analytics. Not only is it free, but provides you with great insights into who is visiting your website and who is actually converting to the goals that are relevant to your business.
This tool is useful whether you are running ads or not because there is always traffic coming to your website.
What is Google Analytics?
Google Analytics, or GA, is a free analytics tool that gives you an in-depth look at your website and/or app performance. It integrates with Google Ads, Search Console, Google Optimize, Google Tag Manager, and other Google products. It's a powerful tool for analyzing traffic, audiences, and user behavior.
Benefits of using Google Analytics
There are numerous benefits of using GA to analyze your website data. Here are the top ones.
Learn where your traffic comes from
Google Analytics can easily show you all your various traffic sources in one succinct traffic report. Traffic sources could include direct traffic, social media, traffic, Google Ads traffic, referral traffic, and social media traffic.
You could see lots of different metrics for each source including the traffic volume, bounce rate, conversion rate, visit duration, device category, and much more. You can drill down into each traffic source and get more demographic information on your users, learn what type of devices they use, and better understand how to optimize your digital marketing campaigns.
Improve your content marketing and search engine optimization
Google Analytics is absolutely vital to the success of any content marketing campaign. It shows the traffic you get to each piece of content and helps you see all the various user metrics you need to optimize your content even further.
Here’s a great video from Andy Crestodina on how to audit your content using Google Analytics.
Pro tip: want help with your Google Analytics setup? Need to create better reports? Check out our list of the top Google Analytics consultants.
Mitigate iOS 14.5 changes with offline tracking
All industries and online businesses were hit hard by the iOS 14 changes. These changes severely limited Facebook’s ability to track conversions and shortened the conversion window of Facebook ad campaigns.
The way to mitigate the problem is to use offline tracking in Google Analytics, which means manually uploading a list of sales data and matching them to clicks on Facebook ads. This will improve your tracking and help you get more accurate data on your campaign conversions.
Here’s a webinar we did with Will Perry, CEO of Reason, going through all the different ways eCommerce brands could mitigate the effects of iOS 14.5.
Another great way to mitigate the decreased availability of data is to plug in all of your various omnichannel data sources together and use an eCommerce analytics tool to view it all in one place.
Understand user behavior on your site
Google Analytics helps you see how users, visitors, and customers interact with your site. It shows you behavioral data that you can use to improve your marketing campaigns, optimize your site, and ultimately improve your results.
User metrics include things like:
- Bounce rates
- Pages per session
- Devices or screens per session
- Sessions per user
- Exit rates
- Top pages & their performance
- Custom events
- Goal conversions
- Site search (your search bar)
- Desktop vs mobile users
Features of Google Analytics you can't live without
Powerful reports
Google Analytics has a ton of reports you could make to better understand your website data. Basic reports include audience overview reports, mobile overview reports, acquisition reports, real-time reports, and traffic reports. You could also create advanced analytics reports and all kinds of custom reports to your heart's desire.
Conversion tracking
Google Analytics provides a way for you to track all kinds of conversions on your site using event tracking. Set up events for every conversion you have and then get data on where users are converting, what pages they are visiting, and extract valuable insights about your customers.
Flow visualization
Another really powerful feature in Google Analytics is flow visualizations. It's a report that allows you to see which pages your users visited and see their entire journey. It gives you a snapshot of how they are engaging with your content and where you may lose them along the way.
Getting started with Google Analytics
For logging in I recommend you use the same Google Account that you use for Gmail, Google Ads, Google Tag Manager, or any other Google product. Once you log in you will have to set up the GA tracking code on your website to start seeing the data. Here's a great guide on how to install Google Analytics on your website.
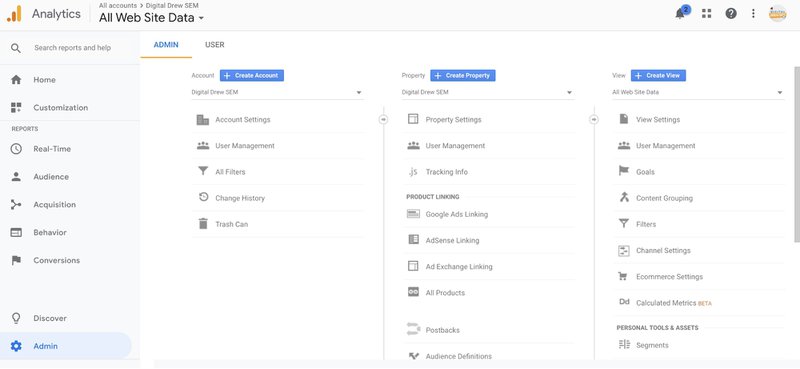
The first place on Google Analytics you should look at is the “Admin” tab (see screenshot above). This is where you can control the functions of your Google Analytics accounts, adjust your settings, and manage your users.
How to add a user
Chances are that you're not working alone, you probably have a whole marketing team to support what you're doing. And the good thing about Google Analytics (and really any of the Google product suite) is how easy it is to share access with other users.
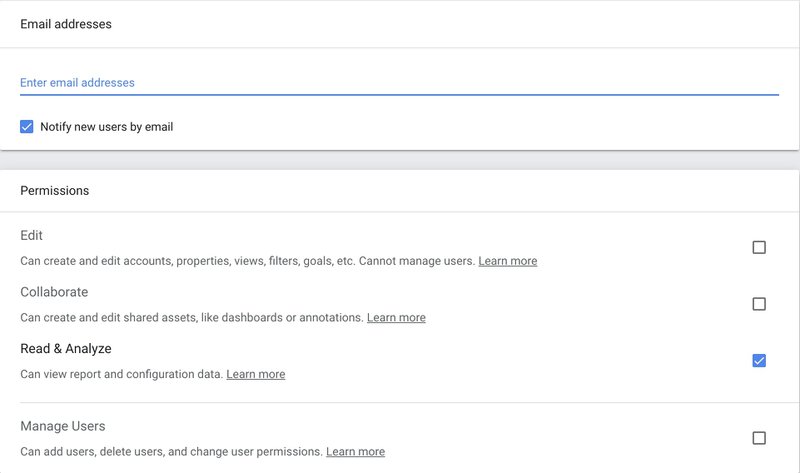
To add a new user go to User Management. This is where you can add and remove users to your business. You can add new users by email by hitting the “+” button. You can chose also to give a user different levels of access such as Read & Analyze or Edit depending on how much control you would like that user to have.
Next, you should sync all the relevant data sources with Google Analytics. Let's talk about the two main ones.
How to sync your Google Analytics with Google Ads
You can find your integrations in the Admin tool is under Product Linking. If you select All Products you can see which accounts are linked. If you are running Google Ads you would select your Google Ads account based on your ten-digit Account ID number. As long as you are logged into Google Analytics with the same Gmail account as your Google Ads account, your Google Ads should appear as an option to link.
How to sync your Google Analytics with Google Search Console
Another account to link under Product Linking is Search Console which is Google’s free SEO tool. Search Console measures the free listings that appear under the search ads when someone does a search on Google. Note in order to link your “Search Console” account you must have verified your website.
Once your site is verified it will appear in the Search Console tab under Product Linking and will allow you to link. Note, you must be using the same email you used to verify your website in Search Console in order to link the two.
How to create audiences
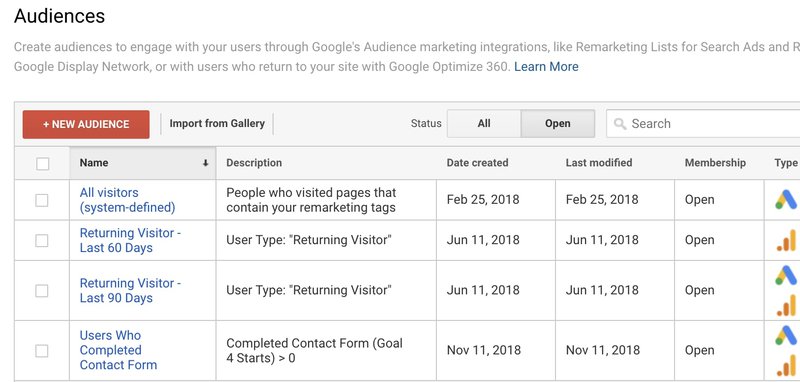
Another useful Admin tool under Audience Definitions is Audiences. This is where you can create audiences to target in your Google Ads campaigns or learn more about who is completing your goals in Google Analytics.
You can look at all website visitors, visitors who visited your website within a certain time frame, or users who completed a goal in the past. You can also create an audience of users who visited a certain page on your website as well or completed a transaction (if you sell products on your website).
The goal is to create as many unique audiences as possible that are useful to your business and will segment users in a way that demonstrates who is completing your desired goals so you can target your ads and your promotional efforts into channels and campaigns that will yield you more business.
How to create goals
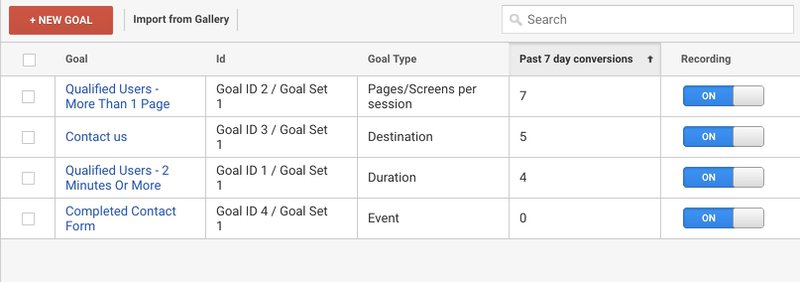
On the far right column of the Admin tool, you will see a flag that says Goals. This is where you create the goals you want to track to help you run your ads and your promotions more efficiently.
By creating the right goals you can track which channels and campaigns are generating the highest return on investment. Just like with audiences, it is important to create a variety of goals. If you do not create enough goals you will not be able to learn which ads are giving you the highest return and be able to optimize your valuable time and resources to help you grow.
How to define qualified users
For myself I created goals around “qualified users” and my desired action “contact us” (as seen above). Qualified Users are people who visited several pages or spent more than a certain amount of time on a website. These users are important especially if they are first-time visitors to your website. If a user clicks on an ad, it is helpful to see if they are a “qualified user” to understand if the ads or promotions you are creating are targeting the right market.
For instance, if someone doesn’t complete the contact form on my website when they are a new visitor, but they visit several pages or spend several minutes then at least I know the ads that I am running are effective. It could be that the user was not ready to take the next step yet and if they see another ad and the next time they click, they will be ready to purchase.
Other actions that can be tracked that would help in defining qualified users:
- Video views
- Newsletter signups
- Location searches
- Button clicks
It is important to set benchmark goals so that way you can optimize each campaign to target those users who complete the right goals along the way to your overall goal, which is a sale or contact to the business. Goals vary based on the website you have.
Ecommerce settings
Also note, if you are an eCommerce brand, under the far right column is the menu item called Ecommerce Settings. This is where you can set up tracking to track actual revenue from your different channels and campaigns in order to understand which channels and ads are making you the most money.
View your audiences
Another import tab category is “Audience”. This is where you can understand your website’s traffic based on demographic and behavioral data. You can also use the goals and audiences you set up in the “Admin” tab to help understand your website’s traffic even better for further optimizations.
The Overview tab gives you an overview of your website traffic as well as users’ engagement with your page. You can understand how much of your traffic is new vs. returning, how many pages your users are seeing, and how long they are spending on your website.
If you see the average pages per session variable being close to 1 or an average session duration of fewer than 30 seconds then perhaps your current website, ads, and/or promotions need to be reviewed. Your goal is to get people to engage and spend time on your website so and help them convert on their first, second, or perhaps the fifth visit.
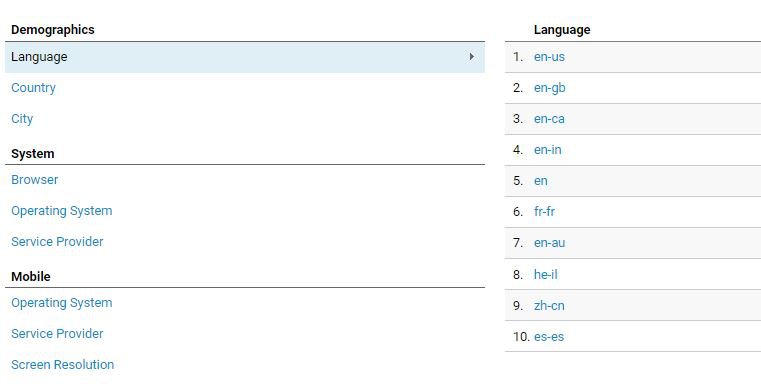
On the bottom, you have a list of various reports:
- Demographics - language, country, city
- System - browser, operating system, service provider
- Mobile - operating system, service provider, screen resolution
When you click on each one it displays the data for that specific variable.
Under the Audiences menu item in the left-hand menu, you can use the audiences you created and see how they performing.
For example, in the screenshot below you can see those who revisited my website in the past 60 days completed at least one of my goals, 72% of the time. Those users also averaged at least two pages per visit and spent over a minute on my website.
What does this show me? It shows me the importance of remarketing and indicates that I should make sure to maximize my remarketing ad budget.
Under Conversions, I selected All Goals to see all of them. If you wanted to isolate each goal individually and analyze each goal by itself you can by hitting the dropdown menu under All Goals and selecting the specific goal that you want to look at.
Study your user demographics
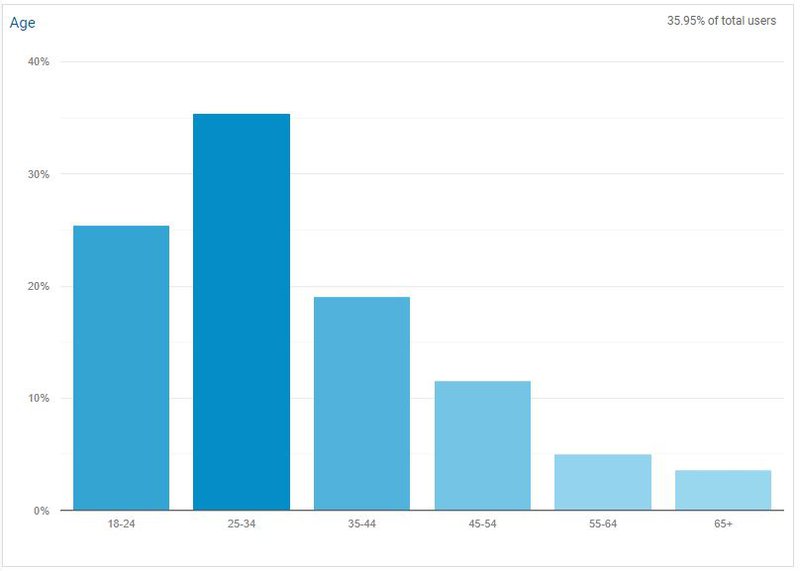
Another tab under Audience is Demographics. This is where you can understand the age and gender of those that are visiting your website. By looking at demographics in “Google Analytics” you can learn how to better target your ads.
For example, I can see a majority of my users are 25-34 and very few are over 55 years old. Therefore, when choosing demographics to target for my advertising campaigns I can choose to exclude people over 55 to focus more of my ad budget on users who are actually visiting my website.
Discover the interests of your users
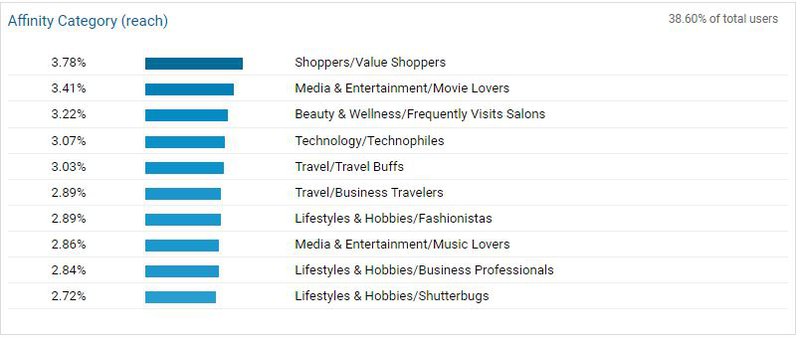
Under the Interests tab, you can see the Affinity and In-Market segments.
The affinity category is a breakdown of the interests of site visitors who have not heard of your brand before. These will help you understand what other interests someone might have that may make them a good customer to target.
For example, those who enjoy sports and are into health and fitness may tend to be business owners who need my services so that may be a potential audience for me.
In-market segments are users who are ready and want your goods or services right now. These are people who Google has determined are ready to make a purchase for a particular category. For my business, it is obvious that these people are in the market for “Advertising & Marketing Services”. However, not every business has in-market segments that are that clear.
Another thing to consider is segments to exclude. Sometimes you see users visiting your website who are in the market for services that you don’t offer or are counter to what you are trying to promote.
For instance, “Employment” is not something I am looking to promote on my website. Since I am looking for new clients, if someone is looking to work in advertising or marketing they will most likely not become a client of mine and therefore I should exclude this category from seeing my ads.
Word of caution: these categories are created to match the ones in Google Ads even though these categories cover everyone who visited your website. Therefore, you can still take these affinity and in-market segments and apply them to social media advertising, but they will not exactly match in terms of their exact name.
Acquisition overview
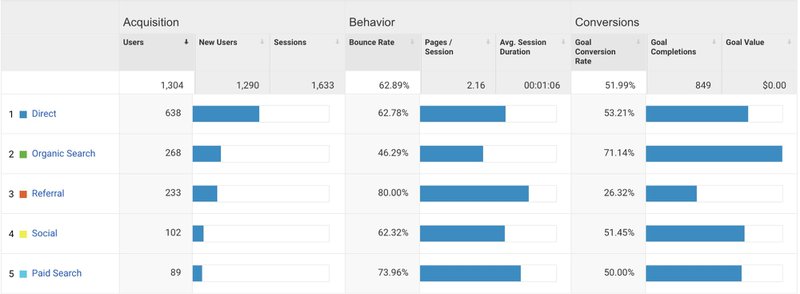
Under the Acquisition tab, you can see how each individual channel influences your overall goals or each individual goal.
The first place to always check is the Overview, which is the acquisition overview report (as shown above). This is where you can see each channel and understand which channels have the most impact on your goals. I look at this data in terms of users and also goal completions.
If you click on each column you can look at the chart from highest to lowest and gain an understanding of where your budget and time were best spent.
The Google Ads tab
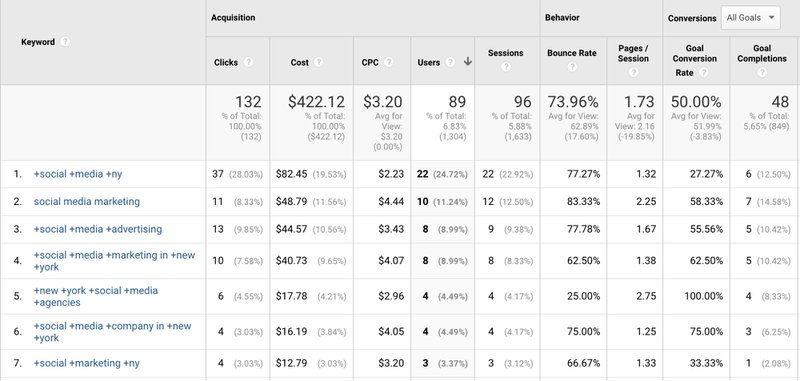
Under Google Ads, look at Campaigns and Keywords. That's where you can find out which advertising campaign and which keywords are converting the highest. You can use that data to create better remarketing campaigns and target better keywords that will convert at a higher clip. You can also see which campaigns are not performing and decrease the budgets on those.
The Search Console tab
The Search Console tab has helpful information about the different search terms (or search queries) that users use to land on your site. This is found in the Queries tab under Search Console.
While you cannot see sales or conversion data you can get ideas on other keywords you have shown up for that you are not bidding on for paid search ads. By seeing those search terms you can add them to your “Google Ads” account and have a higher presence for those search terms when you show up for both paid and organic results.
These can also help you with your SEO and content marketing efforts by giving you ideas for the next blog post or piece of content you should write. This data could also help you determine which type of content works best for your audience.
Social media traffic & conversions
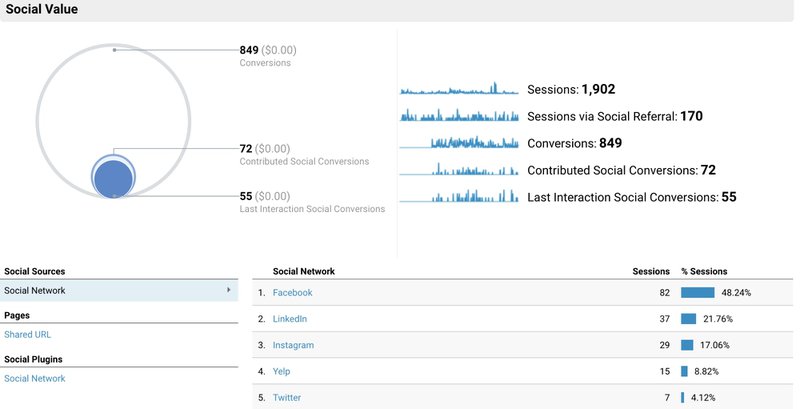
Go to Social > Overview to get an understanding of which social networks drive the most traffic to your site. This will help you determine which channels to focus your time and money on.
You can also see how many conversions you receive from all channels. Also, look at how many conversions were what's called “contributed social media conversions”. This means that social media platforms were one of the channels that influenced a conversion, but the user visited the website more than once and from more than one channel.
"Last interaction social conversions" means that the user converted after visiting your website from a social network and it was the last channel they came through before making that conversion. So either the user is a first-time visitor to your website or they visited your website in the past from another channel such as Google Ads and now visited your website again from Facebook and then converted.
See the entire customer journey
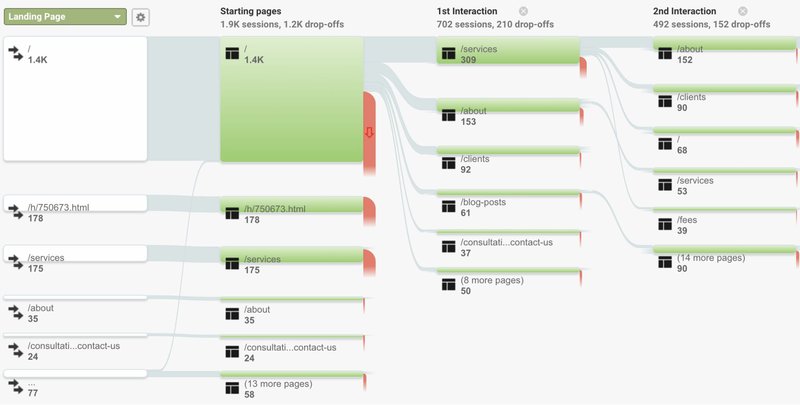
Under the Behavior tab, click on Behavior Flow. Here's where you can see a visual representation of the customer journey. This allows you to have a visual understanding of the paths that users are taking on your website.
You can use this data to see any holes in your website, low-converting pages, or pages with a high bounce rate. If you see users are leaving your site through a particular page you may want to remove that page or rewrite the content on it.
You can also see which pages are performing and chose to expand the content on that page or perhaps drive more ads to it. In the example above, the "services" page is having a stronger engagement and less of a drop-off than the “about” or “clients page”.
In that case, I may want to try driving more ads to the “services” page or work to expand the content on it to provide more insight and value to my potential customers.
Site speed
Another important header under Behavior is Site Speed, which tells you how long it takes for your pages to load.
Site speed can make or break a website so it is key to check your site and individual page speeds at least once per month, for both desktop and mobile devices. The best practice is to get all your pages to load in under two seconds.
People have short attention spans so the longer your pages take to load the more potential customers you are losing. Site speed is also a very important rank factor in Google's algorithm so if your site is slow it will hurt your organic rankings.
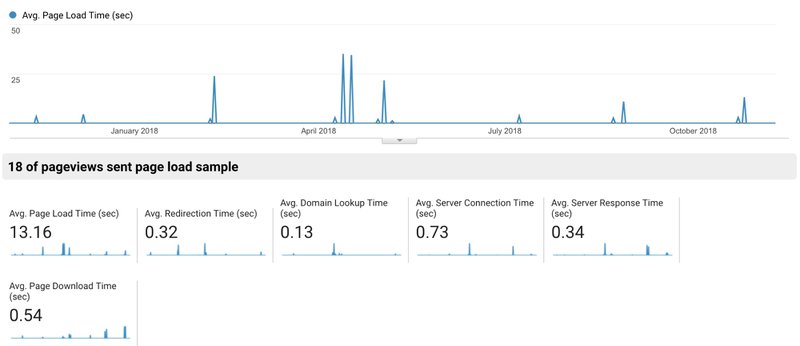
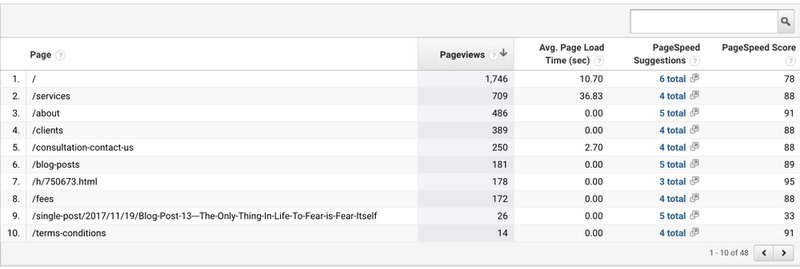
Check out the overview for a general sense of your average page load time in seconds. In my case, you can see that it's at 13.16 seconds which is way too long. I need to do some optimization there.
The good news is even if you are having site speed issues it is easy for you to diagnose the problems and send them to a web developer who can fix the issues. Google Analytics eliminates all the guesswork with a nice list of suggestions (Site Speed > Speed Suggestions).
Click on Page Speed Suggestions for each page (the column in the blue font). This will pull up a pop-up window that will give you a list of suggestions to optimize your site speed.
Overview of goal conversions
The last important tab is called Conversions this is where you gain a deeper understanding of the path someone took towards completing your goals. Many times a user visits your website several times and from several different channels before completing one of your goals. The conversion tab is used to help you understand that path so you target your users properly on each channel.
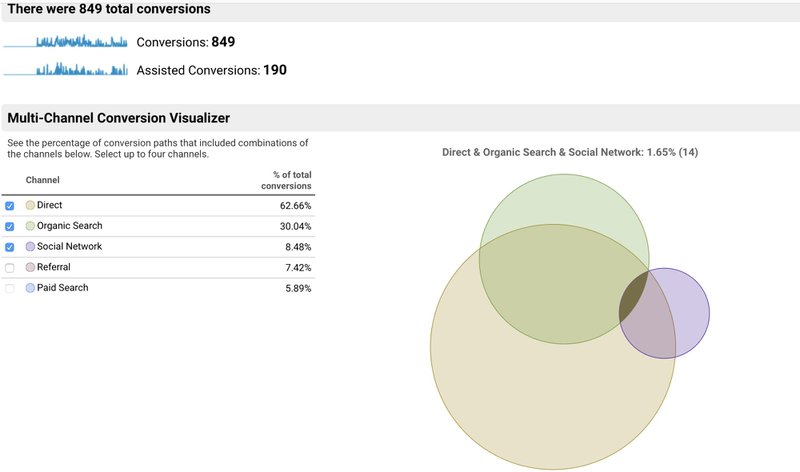
Go to Conversions > Overview to see a quick overview of how users convert on your site. In my case, you can see that out of 849 total conversions, 190 conversions or 22% were assisted conversions. That means nearly a quarter of the people that made conversions on my website visited the website from several channels.
You can also see the percentage in which a channel was involved in the conversion path. For example, organic search was involved in over 30% of conversions. That means people are actively searching and converting from search results even if it is not the first or last channel they visit.
Recap
Google Analytics is a powerful tool that has a ton of useful features for any website. It can help you get valuable data on your users, on your site performance, and on which channels are highest converting for your business.
Use it as a backbone for your marketing strategy and as always, if you need any help with analyzing your data, installing your tracking, or improving your marketing campaigns reach out to us, and we will match you with one of our 600+ amazing marketing experts.
FAQs
Is Google Analytics free?
Yes, Google Analytics is a freemium service that doesn't cost anything for small businesses. This is super rare for an analytics platform of its size. There is a paid plan called Analytics 360 and it's geared towards enterprise companies.
Do you need to add the GA code to every page of your site?
Yes, the code must be loaded on every page of the side but the easiest way to do this is just to place it inside the header, or just after the opening of the <head> tag of the website.
What are the key features of Google Analytics?
Google Analytics has several powerful features.
They include:
- Traffic reports
- Conversion tracking
- Third-party referrals
- Search tracking
- Audience reports
- User interaction reports
- Cohort analysis
- E-commerce tracking
- Custom dashboards
How does Google Analytics improve SEO?
Google Analytics gives you a comprehensive picture of how users reach your pages, interact with them, and various metrics on how those pages perform. This gives you a better understanding of the types of content that work, the types of CTAs that help users convert, and what you need to do to improve your content.
What is Google Analytics 4?
Google Analytics 4 is the next generation of Google Analytics. It has several advantages of the older version (called Universal Analytics) including - improved customer journey tracking, improved user engagement analysis, more powerful audience features and analytics data, better events and goals setup, and enhanced visualizations and reports.
What's a Google Analytics segment?
A segment is a subset of your data. For example, a segment may be all the users in a particular geographic location, or all of your mobile users, or all of your returning users.

